VandaXasset

The leading positioning and flow data platform
150 +

Trusted by 150+ leading financial institutions

220 +

proprietary combined indicators

70 +

intraday time-series

850 +

daily time-series

Seamless Integration

Access a comprehensive set of datasets via a customisable web interface or seamlessly through our API for automated data delivery.

Data that underpins the Vanda framework ​

VandaXasset is a real-time data platform providing institutional investors with cross-asset positioning and flow data. Discover our comprehensive positioning database, monitor specific assets or regions of interest on a daily basis and get a holistic view of the current market environment when in search of new trade ideas. ​

Track Global Market
Positioning In Real Time

Track 1,200+ assets spanning Equities, Fixed Income, FX and Commodities, giving you the edge in tactical macro and risk management.

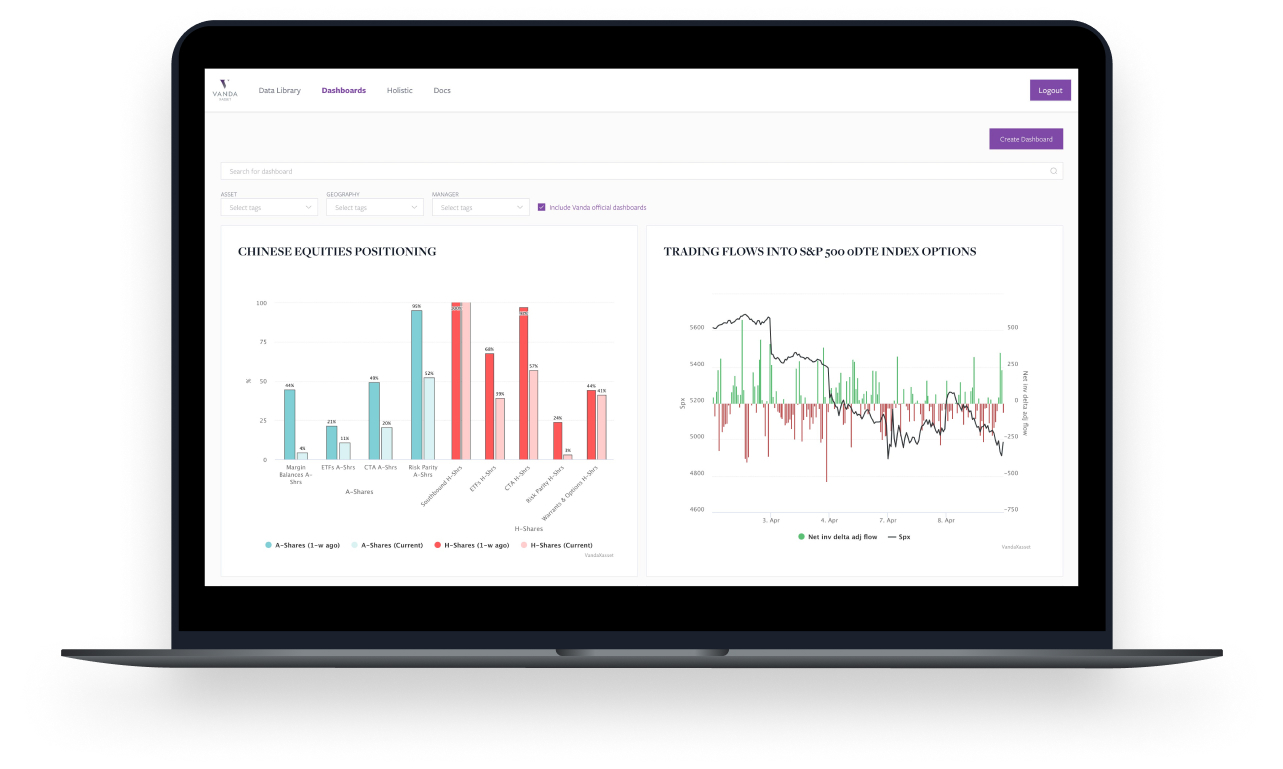
Positioning Data on Demand

VandaXasset was developed in direct response to clients wanting the ability to feed our positioning indicators seamlessly into their models, dig deeper into Vanda’s tactical research framework and leverage our data into their portfolio management tools. With coverage spanning:​

  • Equities
  • Bonds
  • FX
  • Commodities

Key Features
and Benefits​

Real-Time Data

Updated daily across 1,200+ assets​

Multi-Asset Coverage

Equities, bonds, FX, commodities​

Contrarian Signals

Detect crowded trades & positioning extremes​

API & Excel Exports

Seamless integration for quants & discretionary traders​

Frequently Asked Questions and Support

Some of our most asked questions regarding VandaXasset. ​

What type of data is this? ​

VandaXasset offers both disaggregated and aggregated positioning datasets, with a focus on speculative investor behavior. The disaggregated datasets represent our "raw" data inputs, while the aggregated models consolidate multiple speculative investor flows into a single time series.

What unit is your data measured in?

US$ mn, as % of AUM, # contracts, Standard Deviations

Where is your data from and what's the timelag?

Our data spans across all assets (EQ, FI, FX and Commodities), all regions (APAC, EMEA, AMER) with a historic time series from 1st Jan 2010. Majority of our positioning indicators are updated daily or weekly with the lag of updates from t+1, 1-15 hours lag for daily frequency.

What is the number of time series?

Total number of time series is 1,298.

Can I add this data into my own modes?

Yes, via REST API, AWS S3, or via Excel addin.

Let's Talk Positioning

Have questions or want to find out more about our VandaXasset data?​
Contact us directly and we can answer your questions in more detail.

Insights and News

Want to learn more about how Vanda helps institutional investors? Explore the the latest news and insights or get in touch to find out more about our data, research and advisory services.

4 June 2025

VandaXasset: Important improvements to our FX data

3 June 2025

Launching Vanda's Summer Webcast Series

2 March 2025

How to Track Retail Investor Activity, Flows and Opt...

17 December 2024

Tactical Playbook for Q1 2025: Key Insights from Van...

28 May 2024

Team Promotions

20 May 2024

FPE leads buyout of Vanda, specialist B2B research a...

11 September 2023

VandaXasset Press Release

5 June 2023

Financial Times: Net purchases of US stocks hit high...