Self-directed retail investors' turnover in US securities with a global investor origin.
What's New
Speed restores edge. Intelligence replaces hindsight.
VandaTrack has been enhanced with sharper intraday insight, stronger data integrity, and expanded delivery capabilities, bringing institutional-grade clarity to retail investor flows.
Now with live 10-minute updates, an upgraded execution framework, and enhanced platform and API access, it delivers a powerful, real-time view of positioning across US equities and ETFs, built for integration directly into trading and risk workflows.
Live Cash Data
Updated throughout the US trading session at 10-minute intervals.
Enhanced Methodology
VandaTrack reflects an upgraded execution-classification and data-quality introduced in 2024
Full Stock-Level Coverage, Increased History
All US-Listed common stocks and over 13,000 US-Listed common stocks & ETFs, with over 13 years of history.
Enhanced Platform & API
Monitor individual securities, create custom baskets, view intraday intervals and integrate with trading and risk system.
"The Crowd" Isn't Who It Used To Be
That’s why we’re decoding retail flow to help you separate the signal from the noise with VandaTrack, a real-time data platform that provides institutional investors with daily insight into global retail investor activity, tracking net purchases of US listed single stocks and ETFs.
Key Features
and Benefits
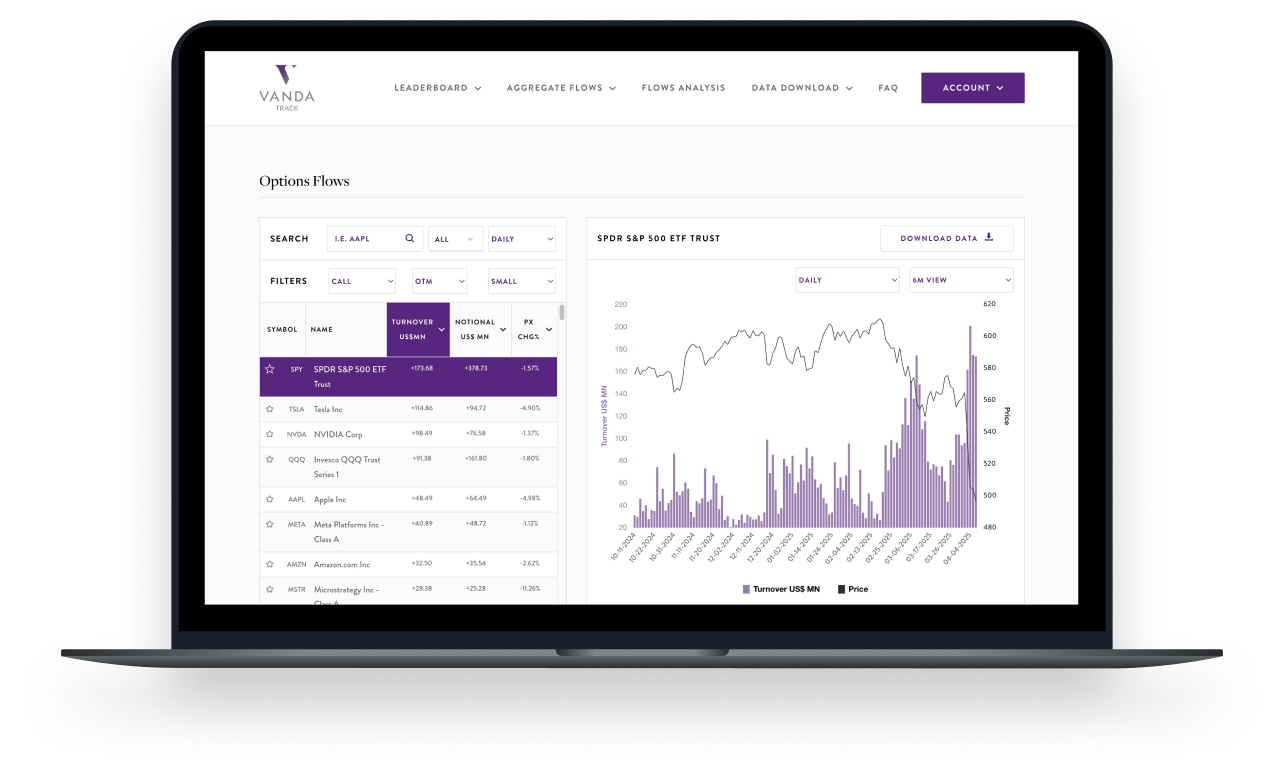
Live Intraday Retail Flow Data
Track live intraday retail flow data across all 10k+ US-listed stocks and ETFs and flow analysis
API & Excel Exports
Seamless integration for quants & discretionary traders
Trading and Options Flow Leaderboards
See which names dominate retail options turnover by premium traded
Smart Filtering Tools
Analyse retail activity and filter securities by benchmark, sector, factor, and theme